The visualization of spatio-temporal data helps researchers
understand global processes such as animal migration. In particular,
interactively restricting the data to different time windows reveals
new insights into the short-term and long-term changes of the
research data. Inspired by this use case, we consider the
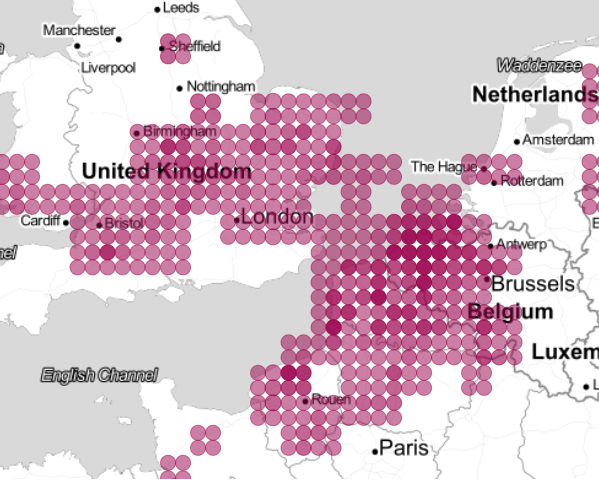
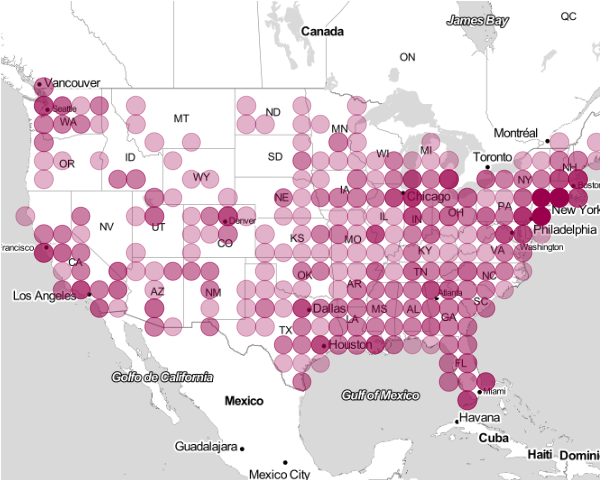
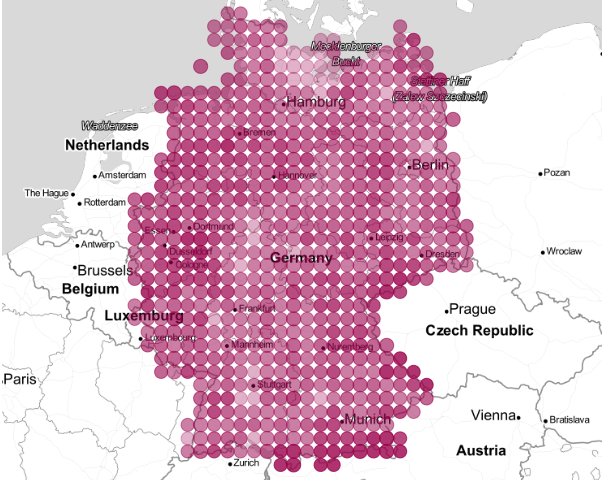
visualization of point data annotated with time stamps. We pick up
classical, grid-based density maps as the underlying visualization
technique and enhance them with an efficient data structure for
arbitrarily specified time-window queries.
We invite the reader to try out our prototypical implementation for the following three scenarios.
The running time of the
queries is logarithmic in the total number of points and linear in
the number of actually colored cells. In experiments on real-world
data we show that the data structure answers time-window queries
within milliseconds, which supports interactive exploration of large
point sets. Further, the data structure can be used to visualize
additional decision problems, e.g., it can answer queries whether
the sum or maximum of additional weights given with the points
exceed a certain threshold. We have defined the data structure
general enough to also support multiple thresholds expressed by different colors.
Contact
Annika Bonerath or Benjamin Niedermann
We obtained the
map tiles by Stamen Design, under CC BY 3.0, and the
map data by OpenStreetMap, under ODbL.
For the visualization we use the implementation provided by Open Layers, under 2-clause BSD License.